
Hey everyone!
Today we are going to take a pause on the audio development posts and talk about something we have been working on for a while now: an open source debugging toolchain for the Smart Citizen Kit.
Sometimes (many times actually), our code won’t do what we want it to do and we need to take a look at what it’s doing. By using a debugger we will be able to see what is going on inside another program while it executes or even crashes. This is fairly straight forward when you code for a modern day computer, since most IDEs have a proper interface integrated for it. However, debugging a chip like the SAMD21 can sometimes be tricky and here is where it’s interesting to use a debugging kit.
Image Credit: XKCD
To keep it simple: our final target is to be able to interact with the SAMD21 (or the chip) while it’s executing the program and tell it to pause the execution, give us the value of some variables and then continue. We will release a fairly extensive report with documentation on this process, but for those interested in reading an overview on how to debug, this post can be a short introduction.
So, here we go! The first item we need is the Open On-Chip Debugger (OpenOCD) which provides debugging with the assistance of a debug adapter. This adapter is a small hardware module which helps provide the right kind of electrical signaling to the target being debugged. These are required since the debug host, on which OpenOCD runs (i.e. your computer, a Raspberry PI…) won’t usually have native support for such signaling, or the connector needed to hook up to the target.
These adapters are sometimes packaged as discrete dongles, which may generically be called hardware interface dongles (and are quite expensive). Some development boards also integrate them directly, which may let the development board connect directly to the debug host over USB (and sometimes also to power it over USB, like the Arduino Genuino Zero). In the case of the Smart Citizen Kit, we have a SWD Adapter that supports Serial Wire Debug signaling to communicate with the ARM core. In our approach, using a complete open toolchain, OpenOCD is running on a Raspberry Pi, and communicating with the SCK’s SWD through the GPIO pins of the Pi.
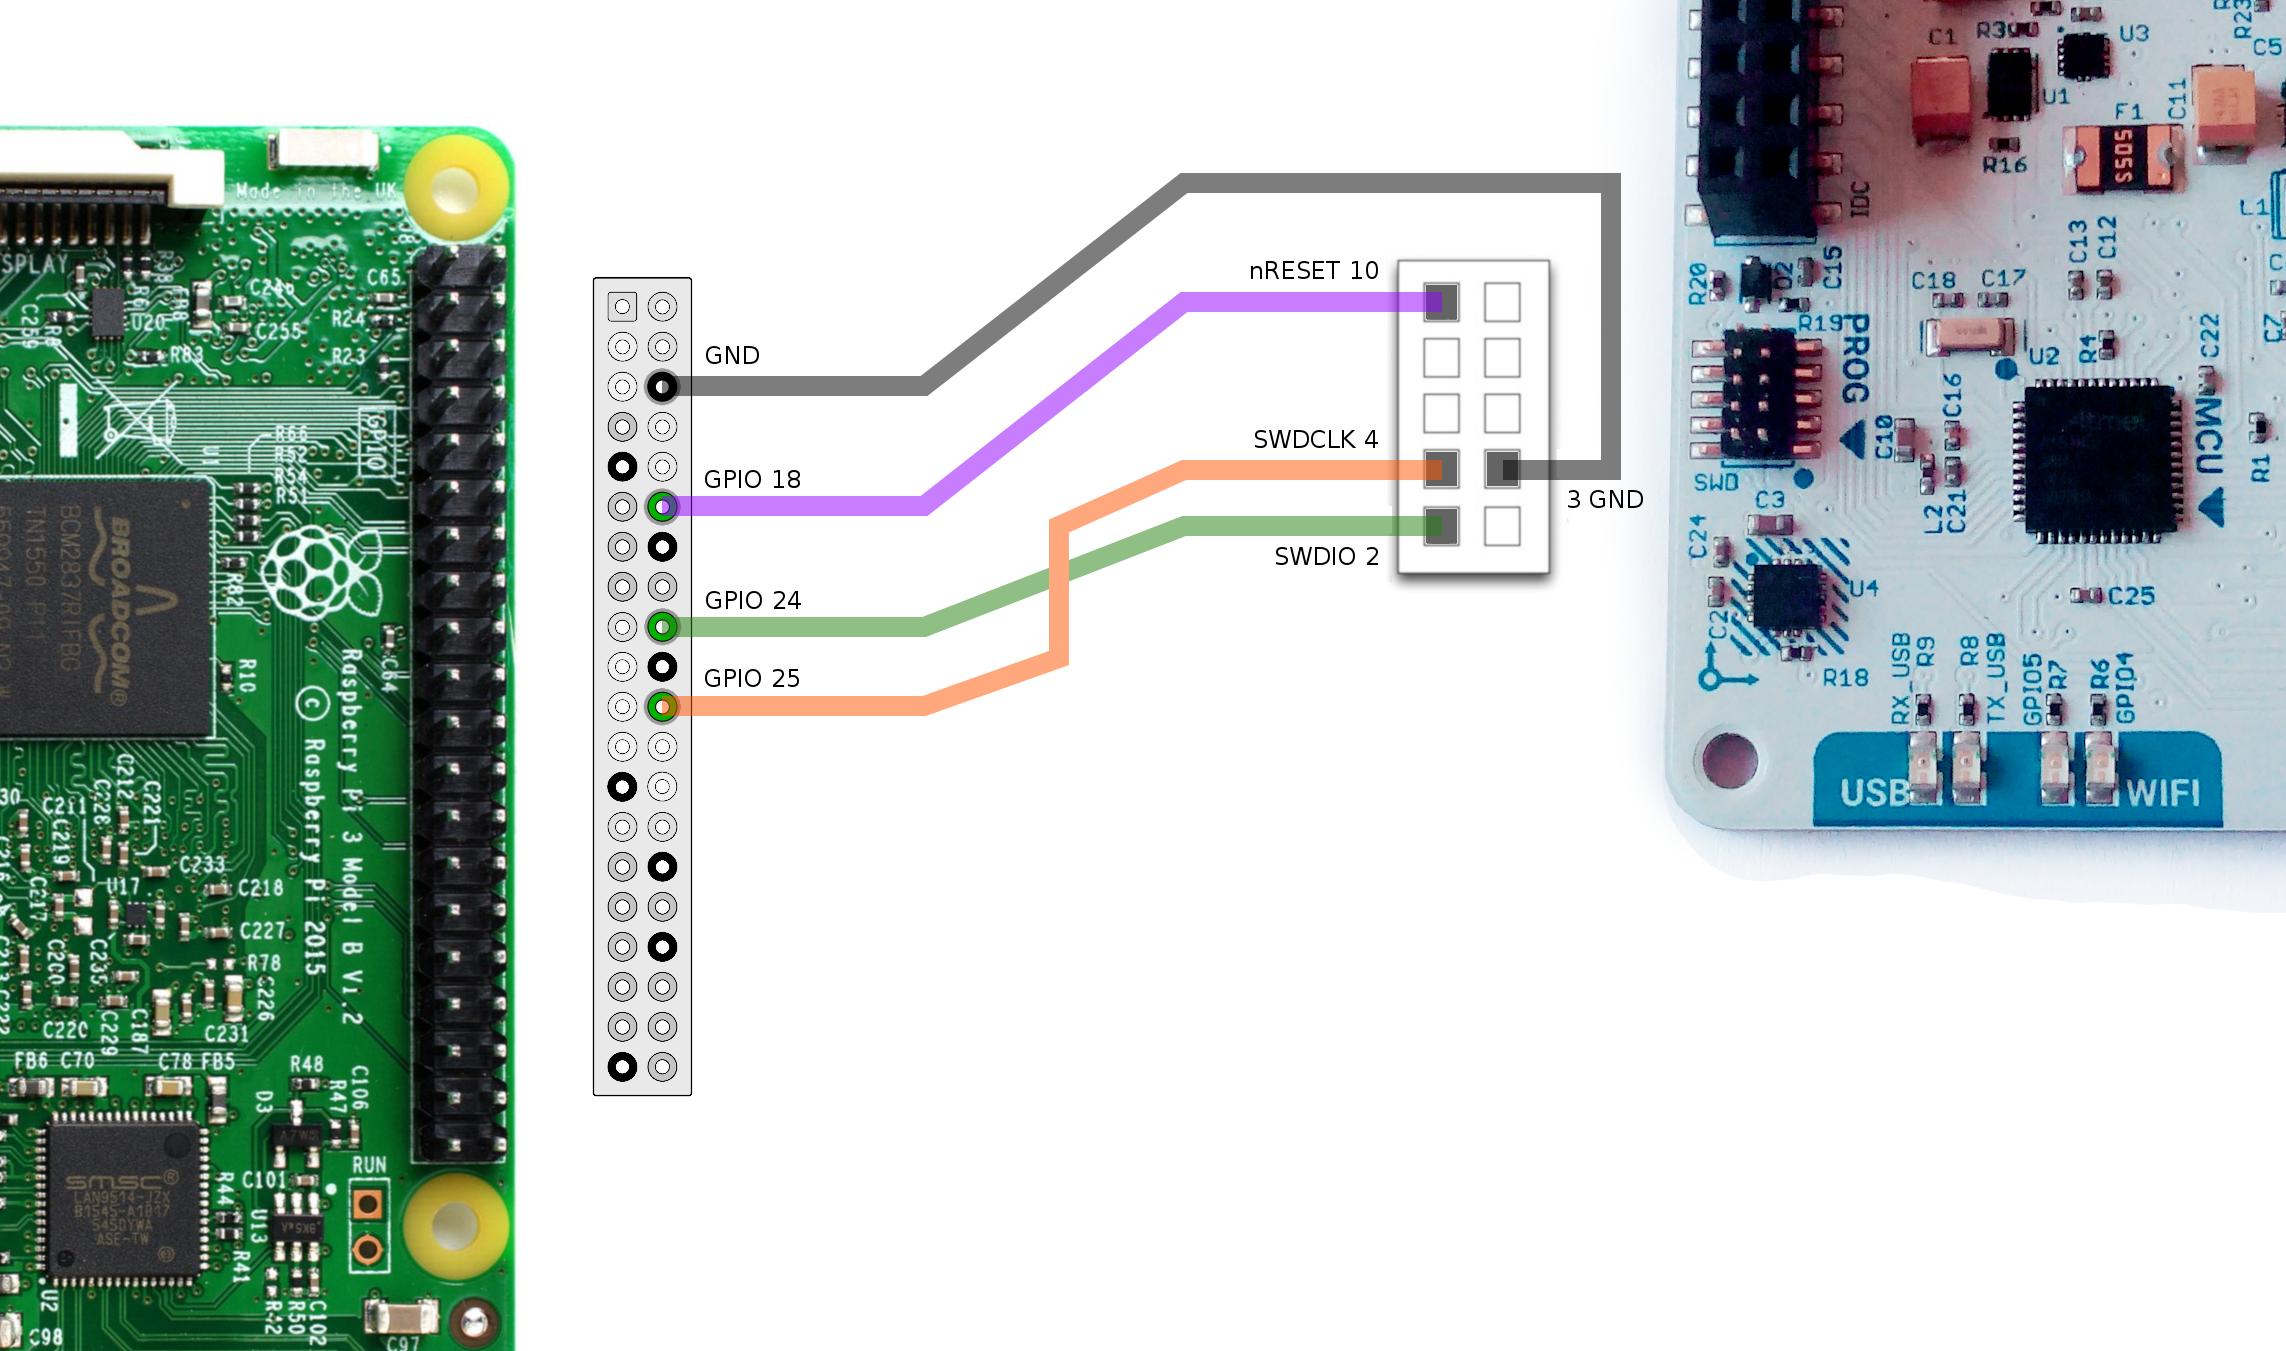
Image Credit: Smart Citizen
Finally, to be able to actually see what is going on inside our firmware while it executes, we need something that is able to read and understand the machine code and hand it over to a human understandable interface. This is where GDB kicks in and helps us by:
- Starting our program, specifying anything that might affect its behavior.
- Make our program stop on specified conditions.
- Examine what has happened when our program has stopped.
- Change things in our program, so we can experiment with correcting the effects of one bug and go on to learn about another.
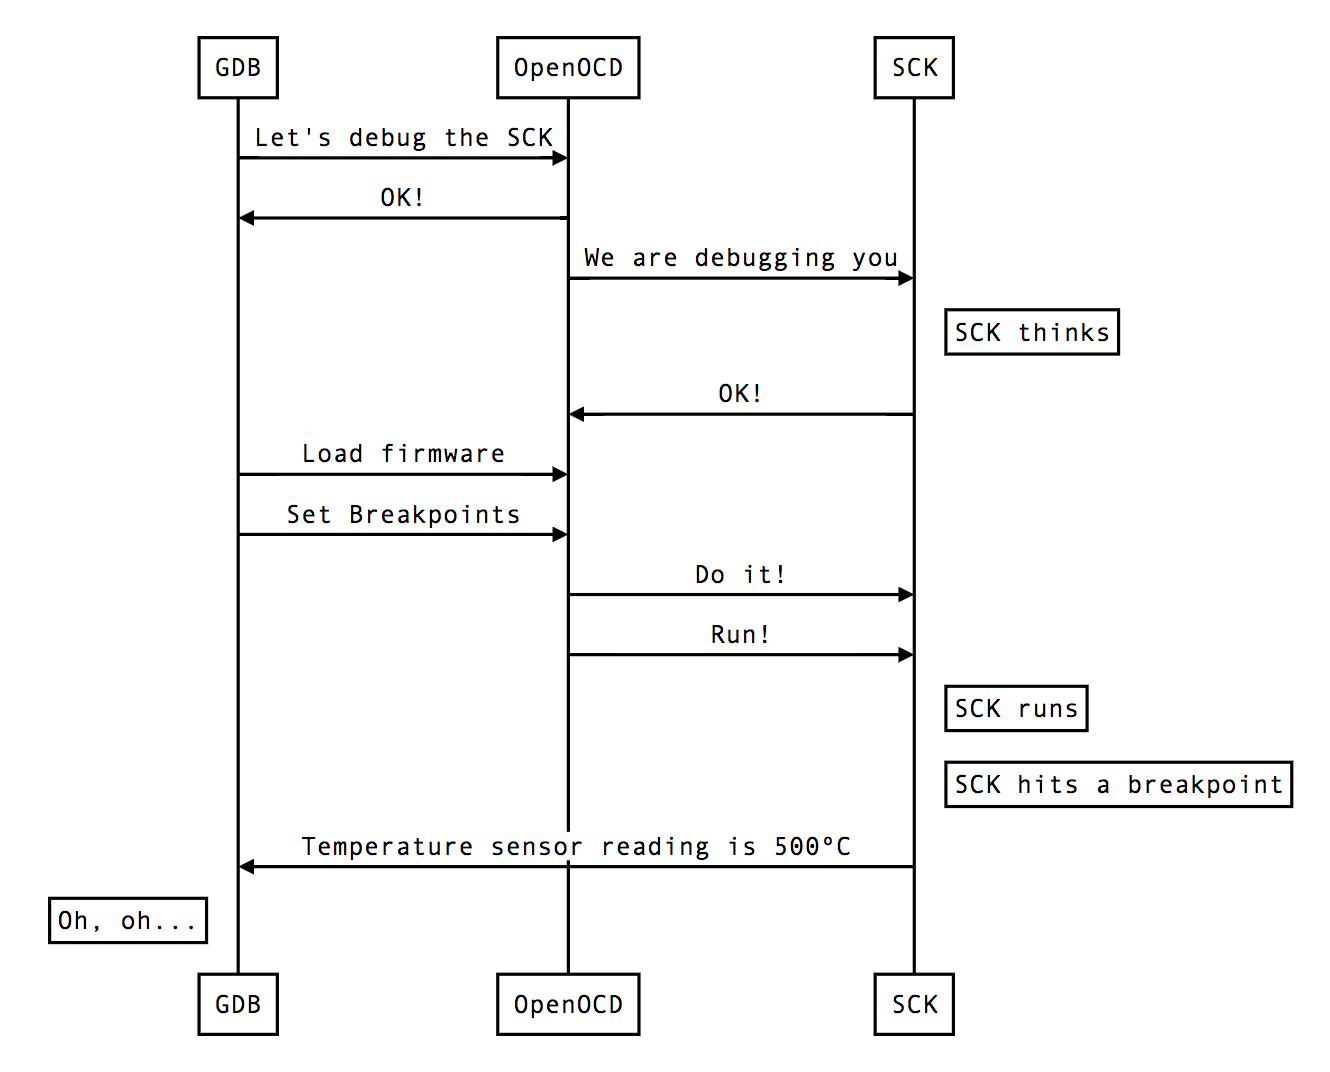
Image Credit: Smart Citizen
GDB and OpenOCD will be running in a Raspberry Pi hooked up to the SWD interface of the SCK, and we will see what’s going on in them from our computer’s terminal via SSH. Fairly simple, right? Now, we can make some changes to our code, make GDB flash it to the SCK and keep debugging in a completely open toolchain!