Has anyone an idea about reference values regarding eCO2 and TVOC?
I know about PPM values but no idea about eCO2 and TVOC, thus I cannot evaluate if a value of 3000 eCO2 that’s a lot or is just acceptable.
Xavi (Barcelona)

Has anyone an idea about reference values regarding eCO2 and TVOC?
I know about PPM values but no idea about eCO2 and TVOC, thus I cannot evaluate if a value of 3000 eCO2 that’s a lot or is just acceptable.
Xavi (Barcelona)
Hi Xavi,
Welcome and thanks for writing!
eCO2 is an interesting topic and can be a bit difficult to get your head around. We have a bit of infomation about it in the docs. The normal value (in a non polluted space) should be the background CO2 concentration in the atmosphere (which has been rising since the industrial revolution up to ~400-450ppm). A value of 3000ppm is quite high, but it does not mean that is a dangerous thing, it might be a bit polluted with a gas that has a high Global Warming Potential (GWP) and hence the value.
Another thing is to look at the sensor values. As we all know, the sensor can present misbehaviours and have unstable readings. A look at the data alongside temperature and humidity values should tell you that.
If you are interested in reading more, I would recommend having a look at these references:
Hope it helps! Please post any more questions or interesting findings!
Hi Oscar,
Thanks for your reply.
As I also own a NetAtmo station, I’m used to get a “single” CO2 measurement so I know that normal values inside home when the balcony doors are open are around 450-500ppm and this value raise up to 1200ppm when doors are closed and we are inside (exhaled CO2).
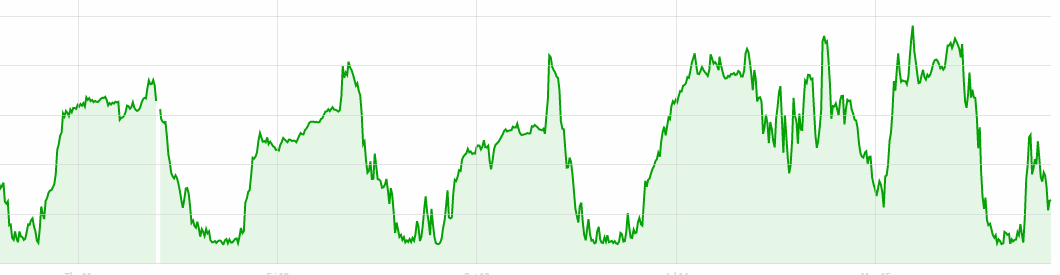
I suspected that the concept “Equivalent CO2” involved a bit more and that’s true. I get values from 400 to 3000ppm in what seems a consistent daily pattern with the minimum around lunch time. (except last sunday when got a high value all day long), so I think the sensors are ok.
Thanks again!
Xavi - Barcelona
Dear Xavi,
Those are some nice patterns! Thanks for replying and including your feedback 
It would be nice to have a look at both sensors compared too if you feel like it.
Thanks again!
Happy to share both measurements (I have chosen the last saturday)
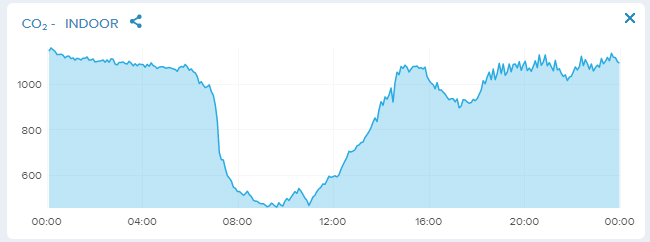
You can see the CO2 drop in the morning when we open the windows and the rise after noon when we close to switch on the air conditioning,
.
(As only can put a single image in a post…second consecutive post)
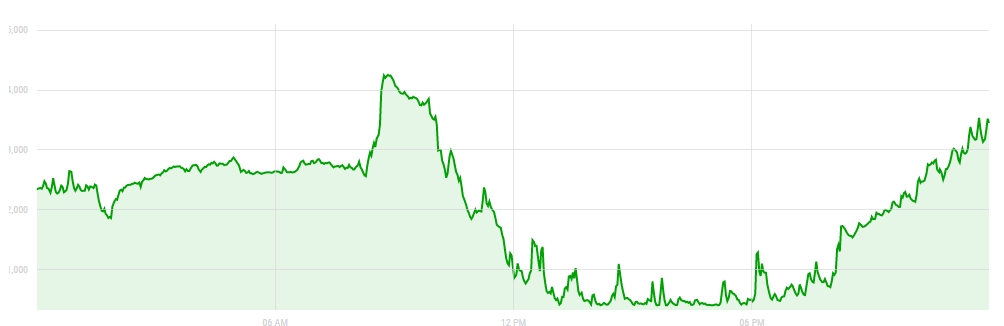
Now the outside measurement with the SmartCity:
While inside home in the morning with “fresh air” got a level around 520ppm of CO2, the Smart measures 2700ppm of eCO2. This is what makes a bit crazy and the only thing I can suspect is the presence of other gases which increases the value of the “Equivalent CO2” and aren’t measured by my NetAtmo Weather Station
Hi Xavi!
Thanks so much for posting this! It’s interesting to see the different measurements in indoor, outdoor conditions.
If you want to go deeper, you can also download the CSV data from the the platform or even request the data directly to the API, if you are familiar with, for instance, python. We have a framework for advanced analysis based on it that can be found here.
Regards!
In the Netherlands there’s a norm than the eCo2 value in schoolbuildings should’nt be above 1200ppm.