Back to Smartcitizen.me

Solar Panel Estimations

Hi!

So this topic is to discuss about the solar panel deployments for sensors. Here there is a link about how to calculate power. Below you see how to input the different configurations (OFF GRID) and the installed peak power, and battery capacity.

In this other guide you can find some more details on the similar tool.

1 Like

More info about this, in particular for the Water Stations.

Normal mode

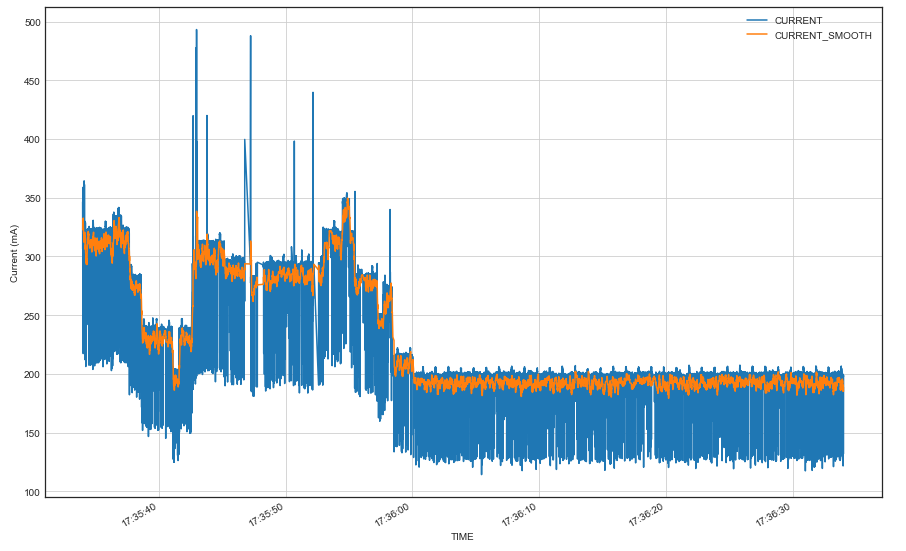
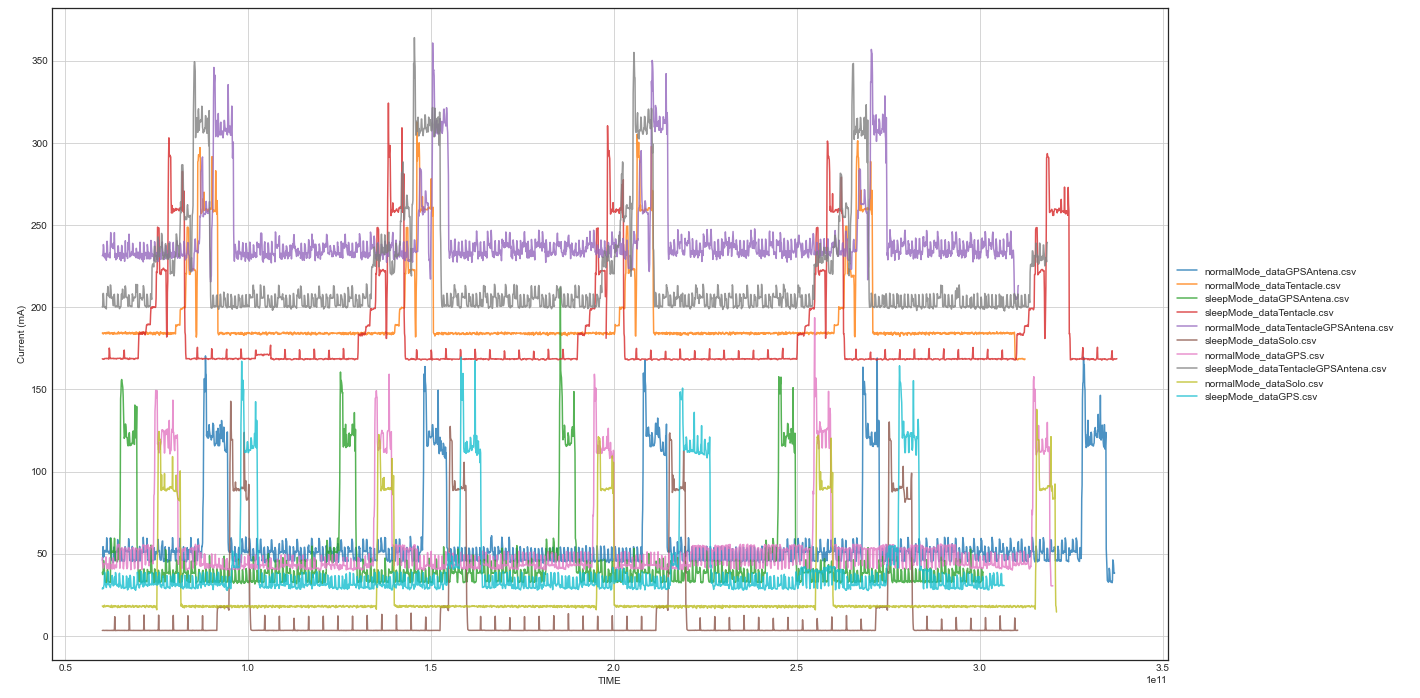
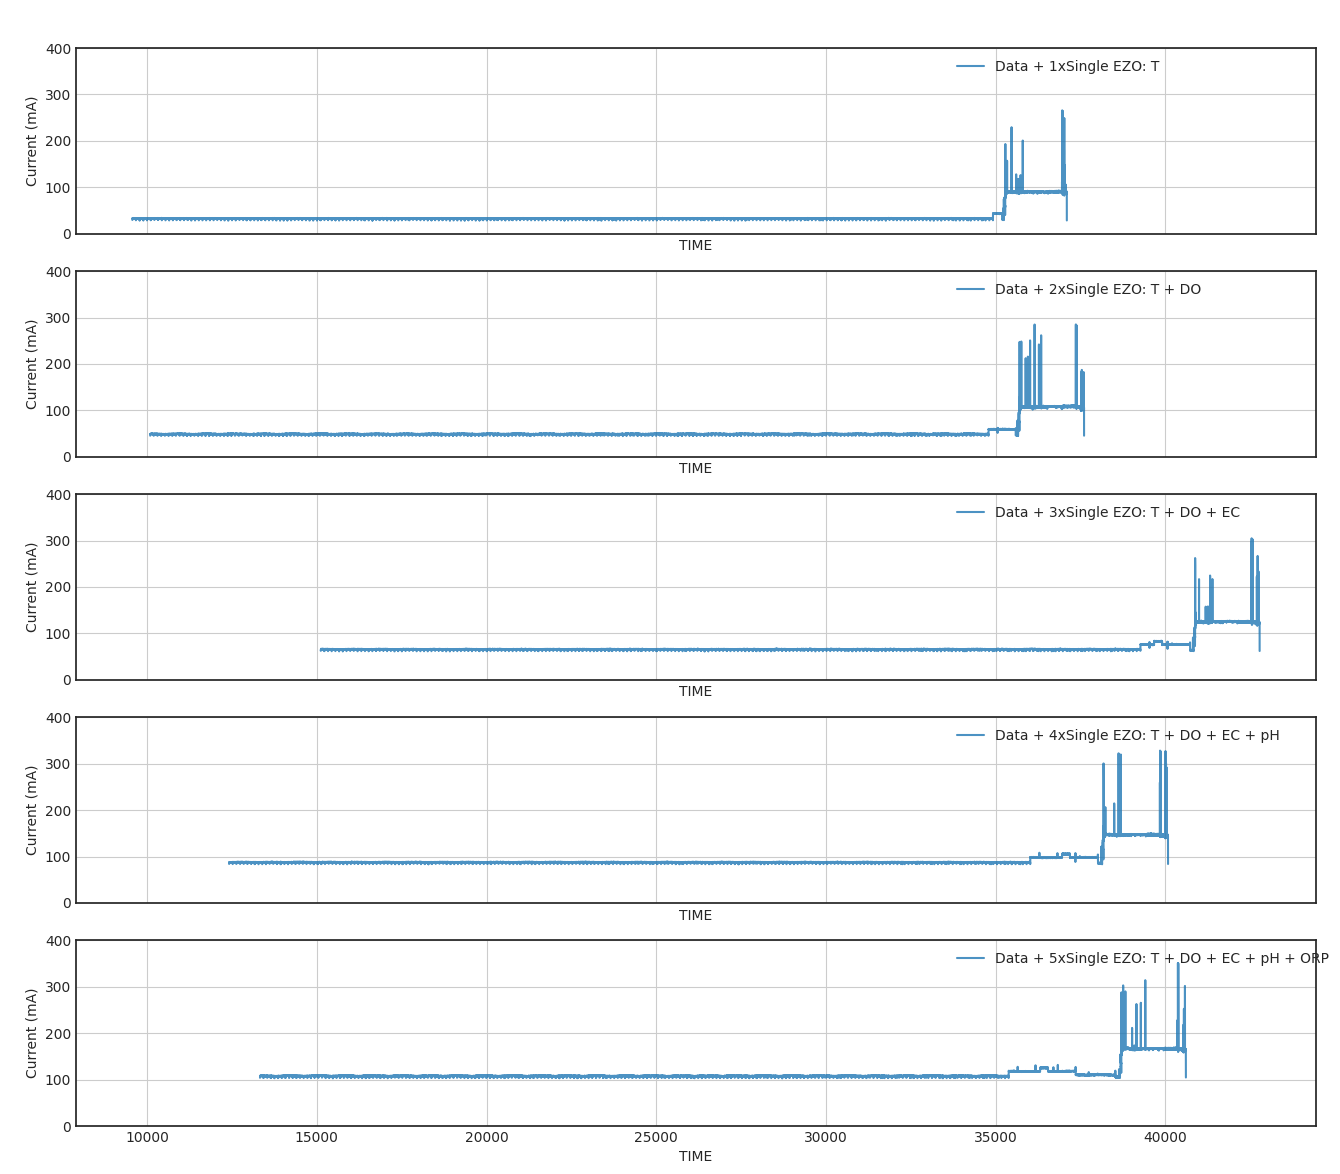
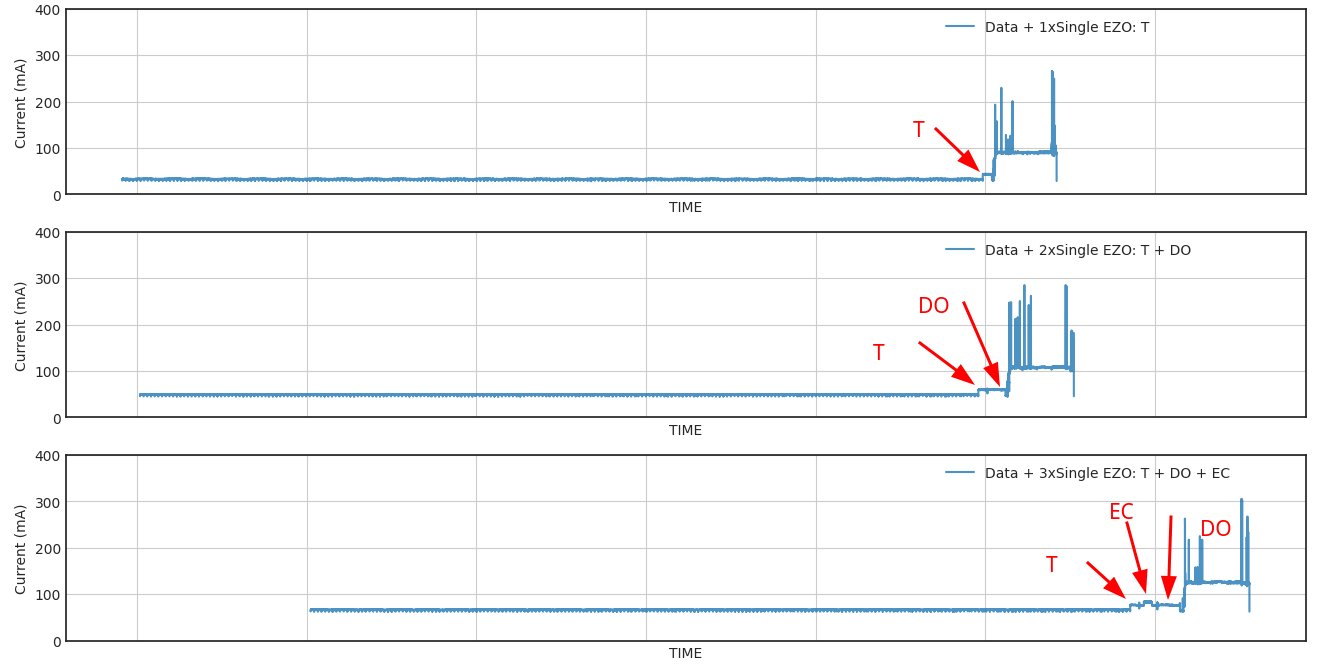
Below there is a minute of recording of current consumption of the kit. Orange trace is there for clarity:

Mean Max Min
Current (mA) 227 493 114
Current smooth (mA) 227 349 179

So, on average, for the first 30’ of operation of the unit, there is 227mA, with a peak of 0.5A. Important to consider that the battery, when is charging, can consume up to 750mA. In the tests, we did not have a battery connected, but when we connected it, consumption went up to 950mA (1A for easier numbers).
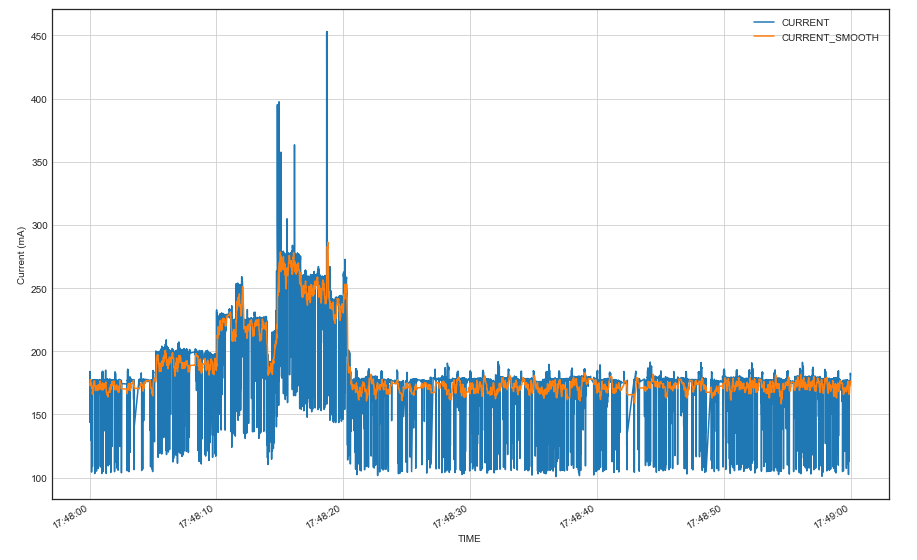
Sleep mode

Mean Max Min
Current (mA) 187 453 100
Current smooth (mA) 187 286 158

Similar, but when the unit is in sleep mode, which is actually the more normal state, which is anytime after 30’ of operation without power shutdown. Here, we put to sleep the main data board, and the probe drivers. However, we only reduce 40mA, as we still have a significant consumption from the carrier boards that support the probe drivers, which amount to 150mA more or less. The rest comes from the GPS. These can help to calculate consumption for a solar panel.

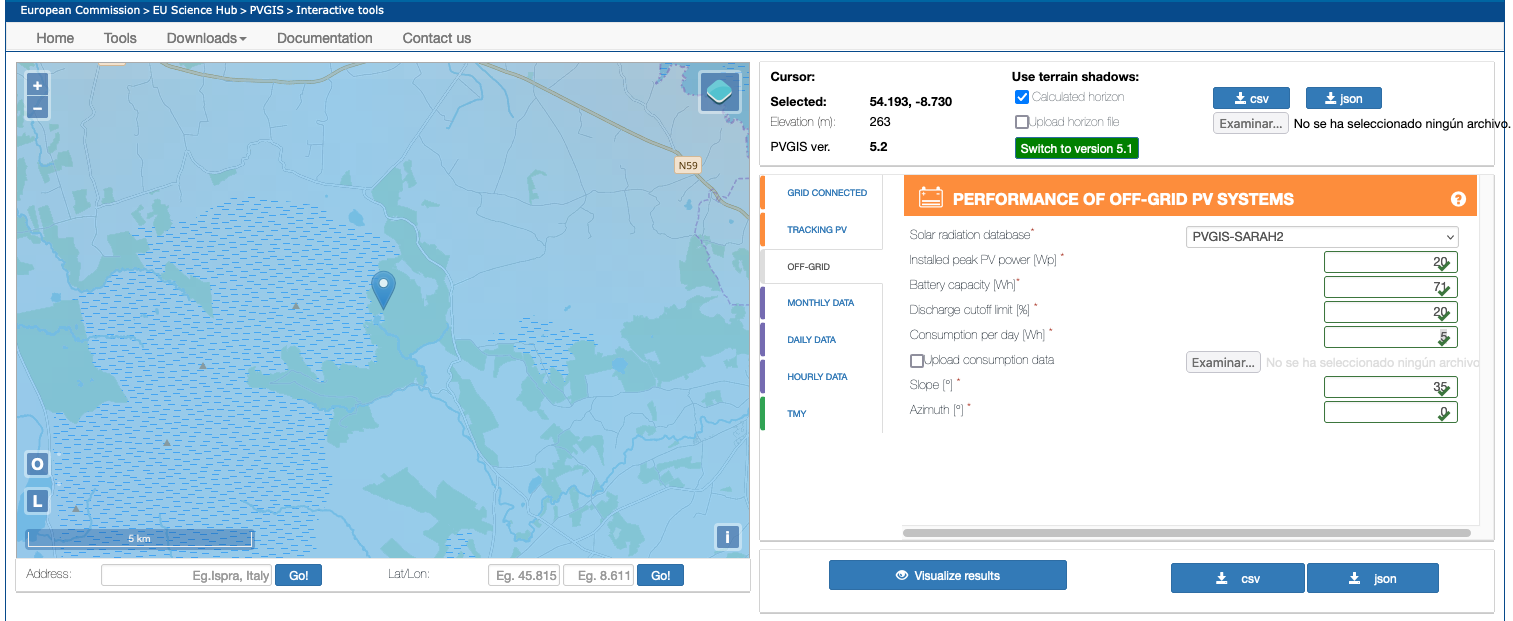
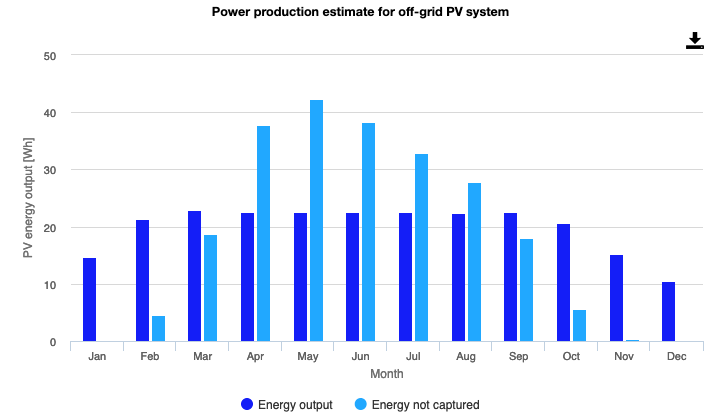
Adding this up, the consumption for the unit (per day) would be: 5V0.187A24h/day = 22.5Wh/day

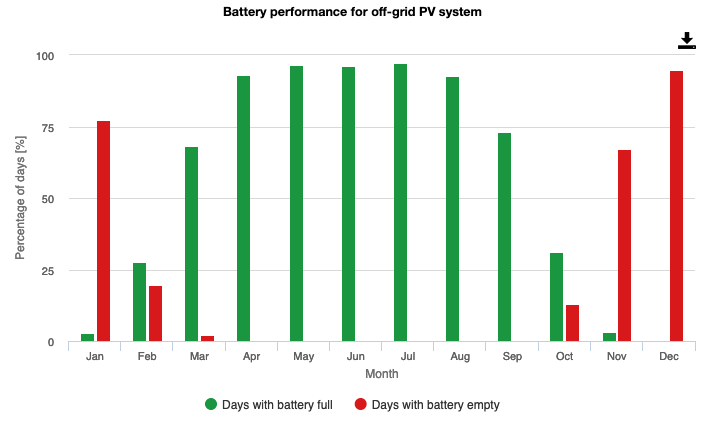
If everything is correct, with this setup, in Sligo, and with a 20W panel and a 20Ah battery (please, check it all because I might have made a mistake in the numbers), the panel wouldn’t suffice from September to March, more or less…

Does it make sense?

1 Like

This is the solar panel that I’ve been testing in Dubllin with the air quality monitor:

It worked very well during the summer. Over the last few weeks the performance has not been that good (we had bad weather), but I think that could be fixed with a larger battery.

1 Like

Hi @anna,

Did you use any additional battery besides the one in the kit?

No, I only used the small battery that came with it.

If your battery was sufficient in the spring/summer/fall but your device no longer has enough power to stay on all day it’s a lack of solar panels that is the problem and not the battery.

If you get a larger battery it will not charge sufficiently to make a difference in the winter.

Can you share a plot/graph of your battery power over the span of a week? Or the last month?

Kind regards,
Cyrille

1 Like

Adding to @cyrille.mdc comment: energy consumption and energy supply are both part of the equation. If increasing energy supply by increasing the size of the solar panel is not possible, or improving it’s orientation, another lever possible is reducing the kit’s consumption. This can be done by increasing reading and publication intervals, or even disabling sensors you might not use, for instance the CCS811 in outdoors.

The kit, normally, is in sleep mode in which consumption is very low. The three major players are the WiFi Antenna (larger publication interval is the one to change), the PM sensor (for which you can change the reading interval), the CCS811 (not so much) and the normal operation of the kit outside of sleep, for which changing the overall reading interval (for all the sensors), it will help.

1 Like

More info regarding this. We have conducted more tests on the Water units, and here there are more insights in terms of consumption.

mode Accessories Mean (mA) Max (mA) Min (mA)
normal - 25.39 137.8 14.48
sleep - 11.99 142.76 3.18
normal GPS 53.74 193.59 30.34
sleep GPS 41.81 169.69 27.56
normal GPS Antenna 57.72 170.35 32.34
sleep GPS Antenna 44.53 211.89 31.32
normal Tentacle (x2) 192.52 312.68 167.95
sleep Tentacle (x2) 182.24 324.19 167.75
normal Tentacle (x2) GPS Antenna 242.33 360.76 204.75
sleep Tentacle (x2) GPS Antenna 219.43 364.01 197.67

Note that the first two options are only Data Board (with battery charged) and on network mode. The tests were done for 5 minutes each, with data posted online 4 times for each of them.
Some insights can be gained from this:

  • Sleep mode reduces 14mA on average
  • Having an external GPS antenna consumes 4mA (interesting)
  • The Tentacle T3 driver we use to connect to the probes consumes a lot! 85mA per board (in the tests we had two boards), and can’t put them to sleep. Probably we will end up making our own board

These numbers can help you make estimations on battery duration on the water units for solar panels and off-grid battery setups. Below there is a graph of the tests:

Hope you find it useful!

More information regarding this topic. We have now explored the possibility of changing the electronics that carry the Atlas Scientific Drivers in the Water Stations. These electronics were originally the Whitebox Tentacle T3, which has a format thought for the 2x20 header of a Raspberry Pi, and it’s meant to work at 5V, despite it’s TTL being at 3V3.

The previous post showed the consumption of the kit using this board. The following tests are done with a Single EZO board from Atlas directly. The tests are conducted with a Data Board 2.1 in normal mode (note that the consumption was already assessed in the previous post), with different drivers connected (1 up to 5), interfacing temperature (PT1000), Dissolved Oxygen, Electric Conductivity, Redox Potential and pH probes.

Normal mode

The results in normal mode are as follows, considering one minute reading and publication are as follows.

Accessories Mean(mA) Max(mA) Min(mA)
Data Board + 1xSingle EZO: T 37.03 265.8 28.28
Data Board + 2xSingle EZO: T + DO 53.5 285.08 44.68
Data Board + 3xSingle EZO: T + DO + EC 70.69 304.8 61.4
Data Board + 4xSingle EZO: T + DO + EC + pH 92.47 327.88 83.08
Data Board + 5xSingle EZO: T + DO + EC + pH + ORP 112.55 350.68 102.6

In the case of 5 sensors, the reduction in power consumption is almost half!

One interesting thing to see is the average addition of one single EZO board + driver, which in each case makes the baseline consumption go up:

Accessories Mean(mA) Addition per component (mA)
Data Board + 1xSingle EZO: T 33.02 Temperature probe + Driver: 7.63
Data Board + 2xSingle EZO: T + DO 49.0 DO probe + Driver: 15.98
Data Board + 3xSingle EZO: T + DO + EC 65.89 EC probe + Driver: 16.89
Data Board + 4xSingle EZO: T + DO + EC + pH 87.48 pH probe + Driver: 21.59
Data Board + 5xSingle EZO: T + DO + EC + pH + ORP 107.4 ORP probe + Driver: 19.92

Finally, just out of curiosity, here you can see the (small) increment while sensors take readings, and identify which driver consumes the most, and for how long.

Long story, short, from now on, it is more interesting to work with these electronics as they provide more flexibility, lower cost and consumption.

Hope you find it useful!

1 Like