eVO2 and TVOC are mathematically related of course. It’s one actual measurement presented two different ways. But IT IS NOT a measurement of actual CO2 gas, it’s other gases collectively glommed to a virtual CO2 value.
{To measure CO2 you would need a specialised sensor such as the NDIR that is now supported by SCK.}
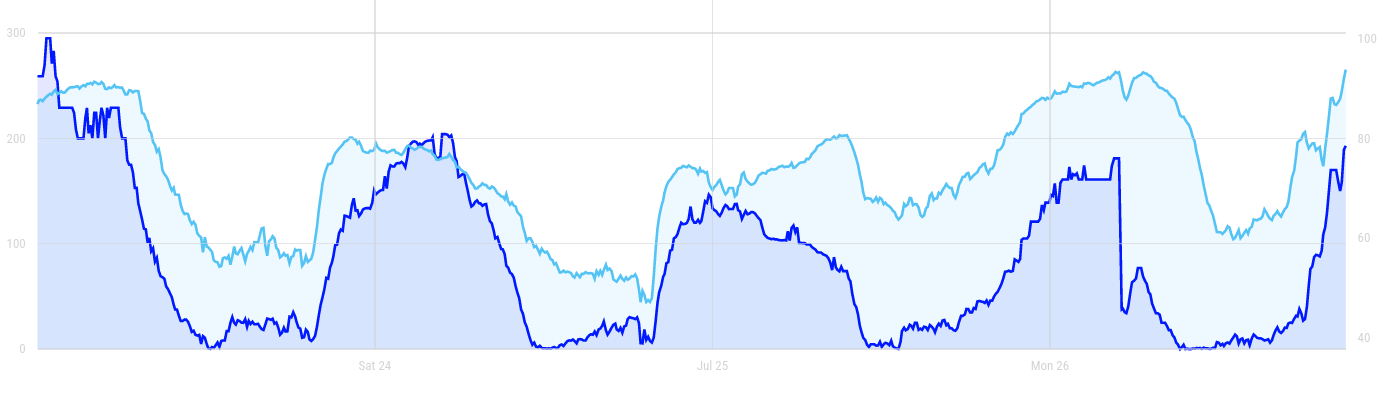
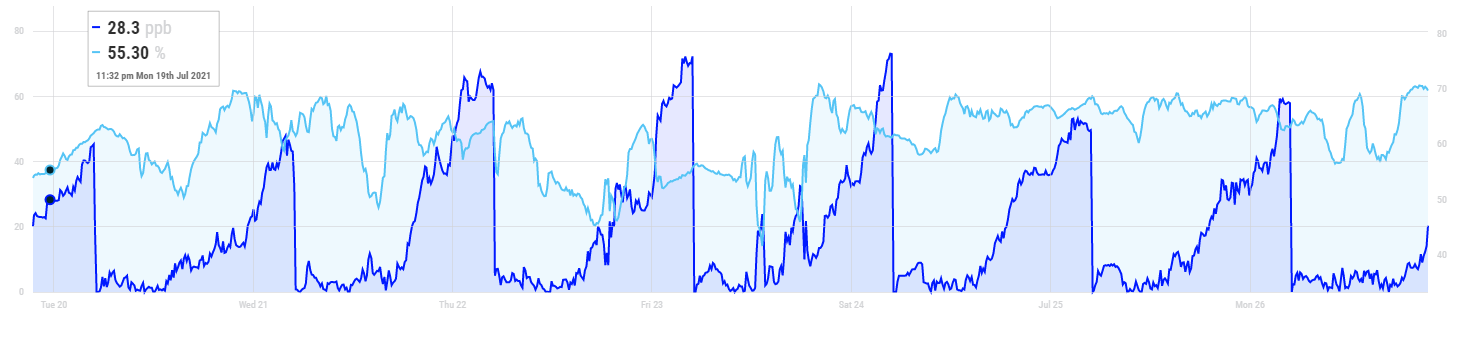
The fact you observe this pattern in the graph for VOC is interesting as you noted.
In this case there are several possible causes for the pattern observation. There are some cause for doubt what it is. The diagnostic objective is to eliminate various possibilities one by one.
It’s useful if you can please tell us a bit more about the situation environment in which this SCK is located.
Is it indoors, inside a house or apartment ? Or outdoors ?
What is going on in the environment at key times indicated in the graph ? (Maybe you need to awaken especially early one day to make this observation).
Conduct some very basic physical checks of the urban board and it’s connection to the data board. Eliminate accumulated dust etc as a confounding cause.
It’s plausible that the sensor is being recalibrated, but I do not think it’s programmed to happen so often. The most likely possibility is that some event in the environment is getting the sensor excited. A further less likely possibility is that the sensor itself is faulty or getting old. (How old is your kit anyway ?)
Always a good check is to connect to the device using your pc and USB cable with a com port monitor program such as Arduino ide or teraterm. Then, using the well documented commands run a few checks on the VOC sensor, look for error reports etc. take screen dumps of interesting pieces and post them here.
So far as environment effects are concerned please do not dismiss the possibility this is something benign such as cooking. Ie a real observation. Someone cooking breakfast including bacon will create large amounts of VOC inside the house.
If VOC accumulates over time inside a space, then someone opens a door or window the gases can escape, and if someone in the house goes to work or goes out for a jog at 5 am it’s explained.
Check for a gas leak. Seems obvious but that would also explain it. Methane is odourless, so they add a tell tale gas to help detect leaks. You might not smell it, if the tell-tale gas is H2S, because your nose can become desensitised.