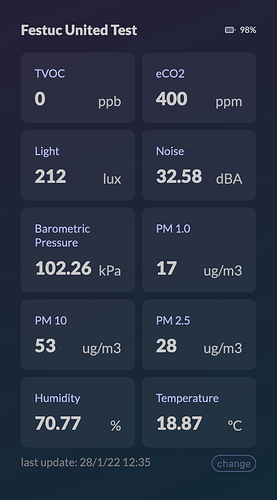
I am working on a side project related to the data visualisation of my kit’s readings. I have one kit I want to follow regularly over the course of the day, and using the SmartCitizen platform proved to be a bit heavy and slow for my usage, since I don’t need the map or access to other kits.
I have create a very simple webapp in which you select a kit by its ID and you then see its readings.
I’d like to share it here, in case other people have the same use case: SC Light
The layout is optimized for mobile, might look a bit strange on a big screen.
Next on my roadmap would be:
- adding graphs for individual metrics
- adding support for more than one kit saved with easy navigation between the kits


